EMSAO
Example 1: Fitting Galaxy Emission Lines
At the Center for Astrophysics, the major use of emsao has been to
get velocities of emission line objects for our various redshift surveys.
To get the best idea of the velocity error, we also use
rvsao.
xcsao
to cross-correlate against an
emission line template,
created by the rvsao.
linespec task, as show in
xcsao Example 2. emsao acts as
a check against misleading cosmic rays and also verifies emission lines.
|
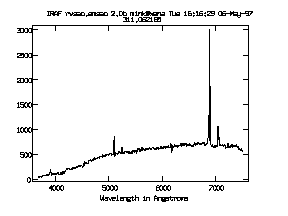
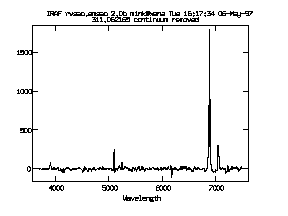
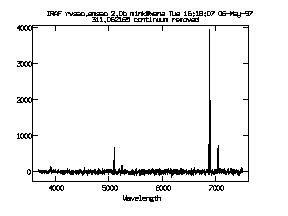
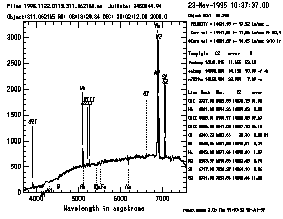
This spectrum shows both emission and
absorption lines; its cross-correlation velocity is derived in
xcsao Example 2.
|

|
Summary Report
The following is written to the files specified by
logfiles if
report_mode is set to 1.
Six alternate report modes exist.
rv> emsao 1995.1122.0113.311.062165.ms
IRAF rvsao.emsao 2.0b mink@xena Thu 12:06:53 10-Jul-97

1995.1122.0113.311.062165.ms Object: 311.062165  RA: 08:13:29.34 Dec: 29:02:12.0
2000.0
Observed 23-Nov-1995 10:37:37.00 = JD 2450044.9428 :  25.30
Combined vel = 14421.18 +-   17.52 km/sec, z= 0.0481
Correlation vel = 14441.81 +-   11.66 km/sec, z= 0.0482 R=   52.5
Emission vel = 14389.87 +-   14.35 km/sec, z= 0.0480 for 9/10 lines

Line  Rest lam  Obs. lam    Pixel     z         vel    dvel    eqw    wt
 OII   3727.30   3905.65   154.56  0.0478  14370.15   81.98   8.44  0.000
  Hb   4861.33   5094.26   963.18  0.0479  14389.62    8.95   7.50  0.031
OIII   4958.91   5196.17  1032.51  0.0478  14368.88   87.67   0.53  0.000
OIII   5006.84   5247.03  1067.11  0.0480  14407.10   36.18   2.38  0.002
  OI   6300.23   6602.66     0.00  0.0000     25.30    0.00   0.00  0.000 X
  N1   6548.06   6861.83  2165.68  0.0479  14390.61    9.29   6.57  0.029
  Ha   6562.82   6877.34  2176.23  0.0479  14392.80    1.87  33.77  0.709
  N2   6583.57   6898.86  2190.87  0.0479  14382.48    3.74  17.35  0.177
  S1   6717.00   7038.27  2285.71  0.0478  14364.10    8.86   6.03  0.031
  S2   6731.30   7053.84  2296.31  0.0479  14390.44   11.00   4.63  0.020
[emsao]
[emsao examples]


