in Astronomical Data Analysis Software and Systems IV, ASP Conf. Ser., Vol. 77, eds. R.A. Shaw, H.E. Payne, and J.J.E. Hayes, p. 496-499.

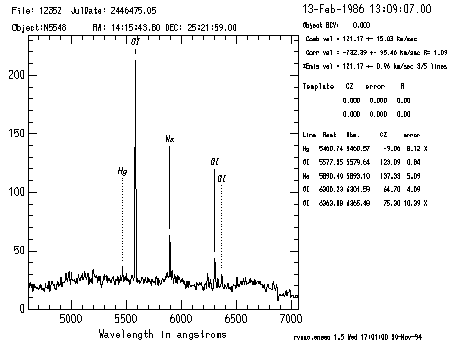
Figure 1. This EMSAO Summary page shows line centers and fit information for a night sky spectrum}
rvsao.emsao 1.5 NOAO/IRAF V2.10.3BETA mink@cfa165 Wed 17:00:55 30-Nov-94

12352 Object: N5548     RA: 14:15:43.80 Dec: 25:21:59.0
Observed 13-Feb-1986 13:09:07.00 = JD 2446475.0480 BCV:   0.00
Combined vel =   121.17 +-   15.03 km/sec, z= 0.0004
Correlation vel =  -732.39 +-   95.46 km/sec, z= -0.002 R=    1.1
Emission vel =   121.17 +-    0.96 km/sec, z= 0.0004 for 3/5 lines

Line  Rest lam  Obs. lam    Pixel     z         vel    dvel    eqw    wt
 Hg   5460.74   5460.57   813.09  -0.000     -9.06    8.12   2.86  0.000 X
  OI   5577.35   5579.64   916.48  0.0004    123.09    0.84  66.60 0.936
  Na   5890.40   5893.10  1178.47  0.0005    137.33    5.09  21.10 0.025
  OI   6300.23   6301.59  1499.71  0.0002     64.70    4.09   9.93 0.039
  OI   6363.88   6365.48  1548.07  0.0003     75.30   10.39   5.01 0.000 X
Figure 2. This is a tabulation, with report_mode=1, of the EMSAO results displayed graphically in Figure 1.
After redshift velocities are determined for each of the lines, an error-weighted mean is computed, omitting the velocities from those lines whose fits do not meet certain criteria. If good cross-correlation and emission line velocities exist for a given object, a combined velocity is also computed. The results may be graphically displayed with emission and/or absorption lines (from a fourth table) labeled as in Figure 1, logged in any of several formats to a file or text terminal, and/or written into the spectrum's header. Figure 2 shows the most verbose tabulation of EMSAO results, with wavelength center and velocity information for each line. If the results are displayed graphically, individual identified lines may be added to or subtracted from the emission line velocity, the spectrum may be edited, and several other conditions of the fit may be changed.
An IRAF program was already being used to convert Z-Machine spectra from SAO's internal archive format to IRAF .imh and .pix files (Mink and Wyatt 1992). A substitute line list was set up with all of the bright night sky lines. Since the mercury and sodium line strengths varied significantly, they were dropped in favor of the more stable oxygen lines. The 6300 Angstrom OI line can show significant variations in intensity within a single night, but that's a story for another paper. The screen output of EMSAO for an individual night sky spectrum is shown in Figure 1. An IRAF CL script was written to run through the entire archive, or portions thereof, with a single command.
00001  2443575.69726    21   0  2804 44   3.5 2804  44 E  1  1     21.38      0.00      0.00
00002  2445219.24201    13   0  1828 34   4.8 1828  34 E  1  1     13.27      0.00      0.00
00003  2443575.79326   -37   0     0  0   0.0    0   0 E  1  1    -37.00      0.00      0.00
. . .
27169  2449342.03237    -2   1 35477 62   2.1   -2  62 E  3  3      4.85    -17.34    -32.84
27170  2449336.76664   -28   0  4069 45   2.9  -28  45 E  3  3    -27.92    -28.44    -38.31
27171  2449300.78227   -17   0  5465 26   6.2  -17  26 E  3  3     -9.00    -30.71    -41.82
Figure3. A portion of the tabulated results for 27,171 night sky spectra produced by EMSAO with report_mode=3.
The results were tabulated in a file shown in Figure 3, where the columns are reduced file number, Julian Date of observation, emission line velocity and error, cross-correlation velocity (from a galaxy template) with error and R-value, combination velocity and error, quality flag, number of lines found, number of lines fit, and velocities in km/sec for OI lines at 5577.35, 6300.23, and 6363.88 Angstroms.
Due to the distribution of lines in the calibration lamp spectrum, the position of the OI line at 6300 Angstroms was most certain. Figure 4 shows the velocity shift computed from the change in the position of the center of that emission line over the 15-year lifetime of the Z-Machine spectrograph on the 1.5-meter Tillinghast Reflector. Each vertical grouping is one month's dark-time run, with larger gaps usually indicating summer telescope shutdown. It is obvious that some runs had a large scatter in sky "velocities", but for the most part, the sky "velocity" distribution is within the 63 km/sec a one-pixel shift in the emission line would cause.

Figure 4. Velocity shift in 6300 Angstrom OI night sky line over 15 years as observed from Mt. Hopkins, Arizona
Mink, D.J. and Wyatt, W.F. 1992, A Production System for Radial Velocity Measurements, in Astronomical Data Analysis Software and Systems I, ASP Conf. Ser., Vol. 25, eds. D.M. Worral, C. Biemesderfer, and J. Barnes, 439. [abstract] [full text]
Tonry, J.L. and Wyatt, W.F. 1988, CFA Z-Machine Data Analysis Software Cambridge: Smithsonian Astrophysical Observatory.