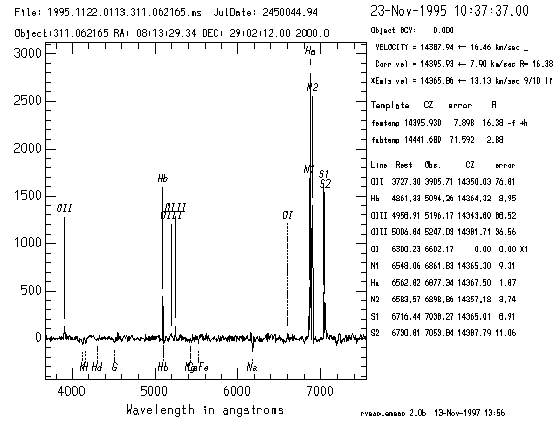
This display of the entire spectrum, velocities from each line, and
cross-correlation velocities from a
previous run of
xcsao is produced if
dispmode is 2 and
the k cursor command is used.

[summary graph]
[whole spectrum]
[Ca H and K]
[H beta]
[Na]
[H alpha]
[emsao log]
Click on graph to put continuum back
